# Shop dashboard
Your shop dashboard page gives you a full overview of statistics and metrics relevant for your online shop over a selected period of time. To select the period of the displayed data, go to the top right corner of your Shop dashboard and select the preferred period from the drop-down menu.
# Quick links
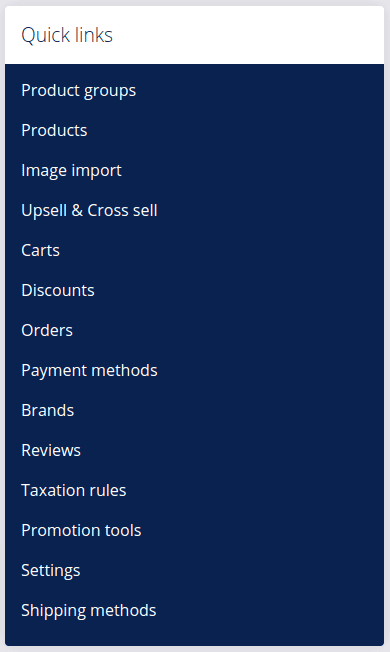
For easier access you can use the Quick links menu on the right and directly access your main shop settings such as products and orders, but also other general settings relevant to your shop, such as payment and shipping methods, taxation rules and many more.
Below you can find short descriptions of all the metrics and statistical data on your Shop dashboard:
# Shop revenue
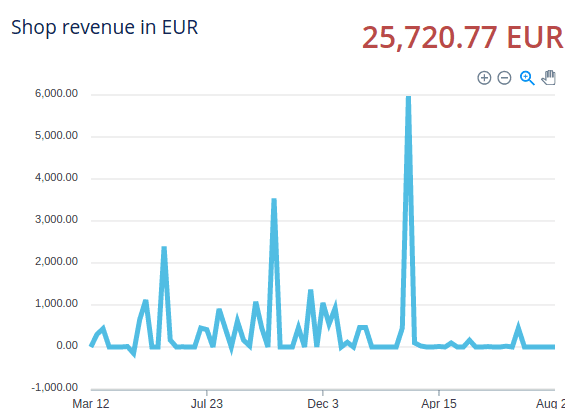
The Shop revenue in the chosen currency graph shows the revenue of your shop for the selected period. Note that the statistics are generated for the current moment and do not change for the past. Example: even if your orders get canceled, the statistics of your shop orders will not change
# Orders
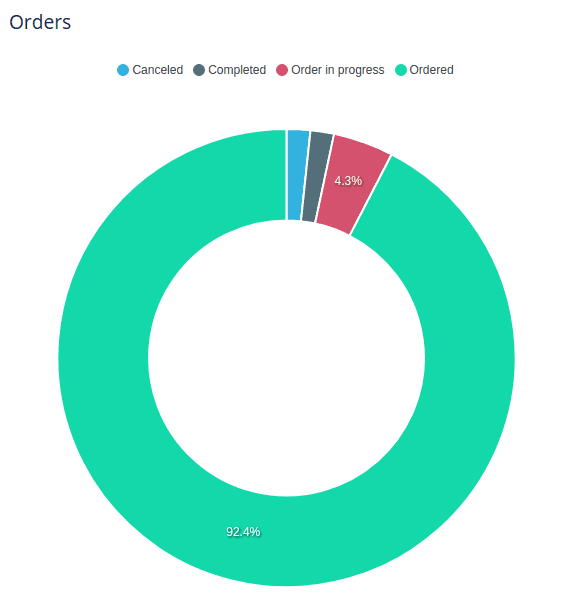
In the Orders donut graph you can see a breakdown of your orders depending on their status. If you scroll over a specific section, you can see the number for each type of order.
# Orders statistic
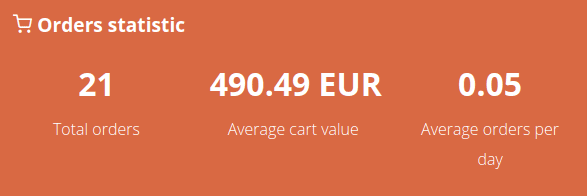
The Orders statistic summary shows the total amount of orders, average cart value and average orders per day in the selected period of time.
# Top 5 best-selling products
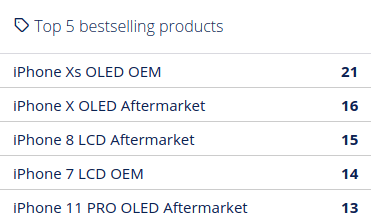
The Top 5 best-selling products section shows 5 products that are sold the most.
# Top 5 customers
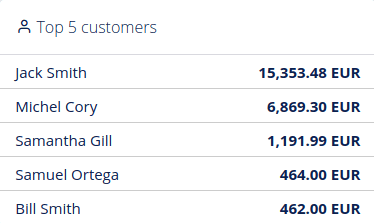
The Top 5 customers section shows the customers who spent the most in your shop.
# Top 5 flipped products
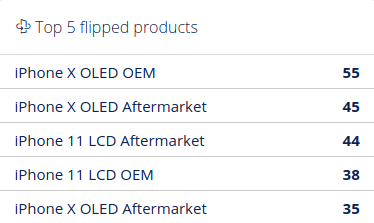
The Top 5 flipped products section shows the most frequently flipped products.
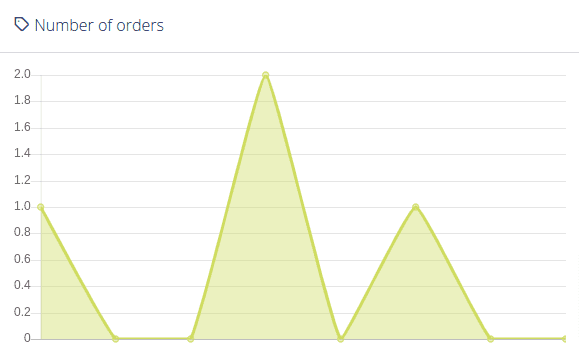
# Number of orders
The Number of orders graph shows an overview of all your orders over the last 7 days. By hovering over the nodes in the diagram you can also view the data for each specific day.
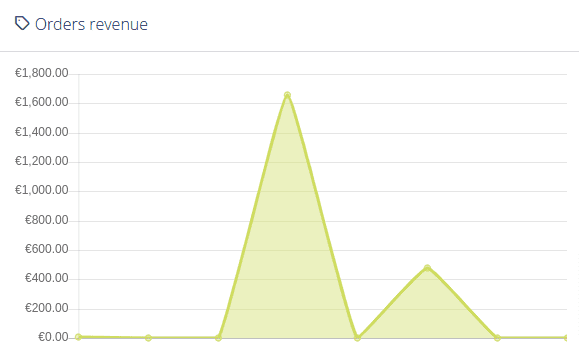
# Orders revenue
The Orders revenue graph shows the revenue generated by your orders over the last 7 days. By hovering over the nodes in the diagram you can also view the data for each specific day.
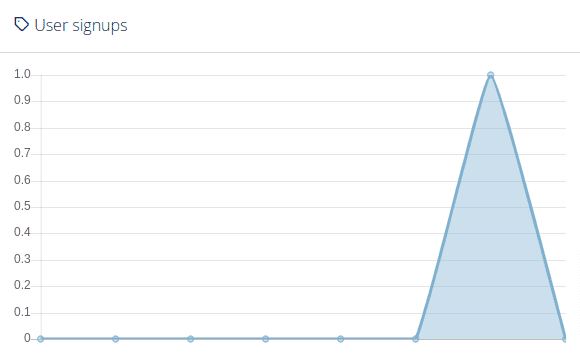
# User signups
The User signups graph shows the number of users who signed up to your shop over the last 7 days.
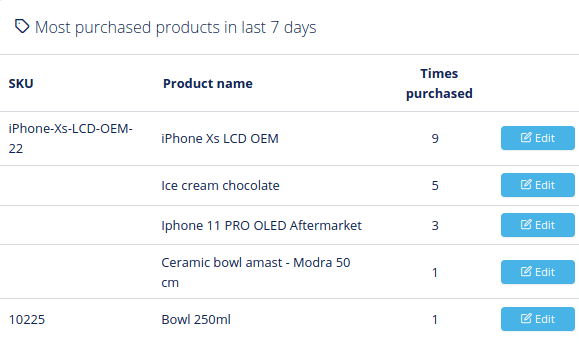
# Most purchased products in the last 7 days
The Most purchased products in the last 7 days table shows the products which have been purchased the most over the last week. Here you can see the SKU (if applicable), product name and the number of sold items. By clicking the Edit button next to each product, you can also directly access and manage each product.
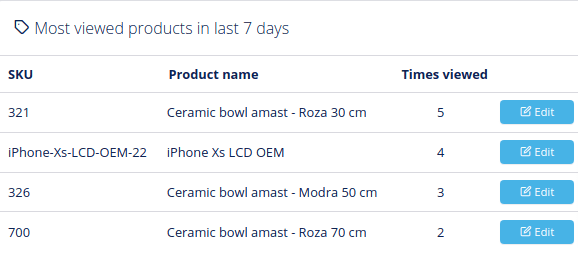
# Most viewed products in the last 7 days
The Most viewed products in the last 7 days table shows the products which have been purchased the most over the last week. Here you can see the SKU (if applicable), product name and the number of times they were viewed by your customers. By clicking the Edit button next to each product, you can also directly access and manage each product.
# Out of stock products with the most product alerts
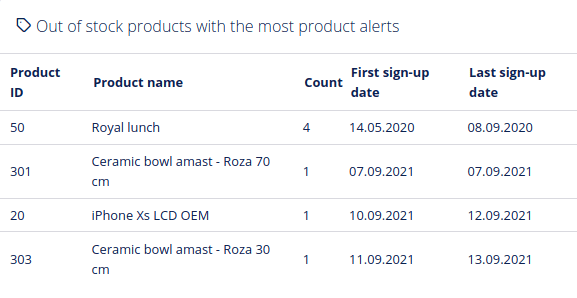
In the Out of stock products with the most product alerts (requests) section you can see the products, which your contacts are most interested in being notified about once they are back in stock.
# Links
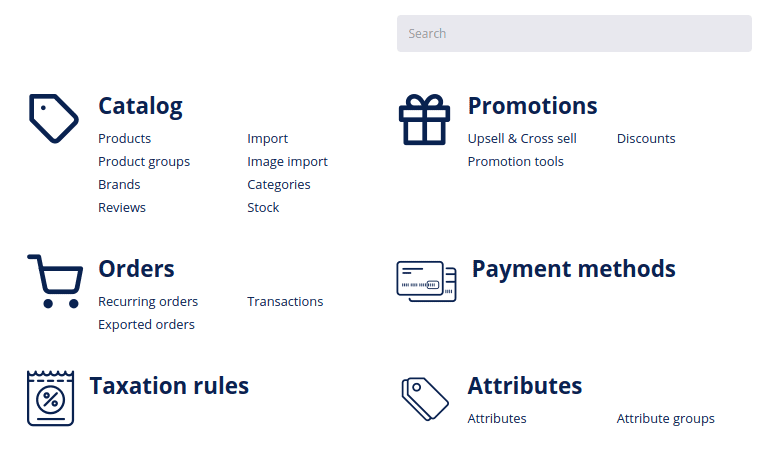
If you know what you are looking for, but don’t quite know where to find it, you can use the search section at the bottom of the Shop dashboard page to quickly find and navigate to the required settings or index page within your shop. The incremental or real-time search field will instantaneously return results as you type, providing the searched keyword can be found within DG1 Shop settings.
