# Marketing dashboard
The Marketing dashboard gives you a full overview of your marketing activities and contact growth within a specific period of time. To select the period of the displayed data, go to the top right corner of your Marketing dashboard and select the preferred period from the drop-down menu.
# Quick links
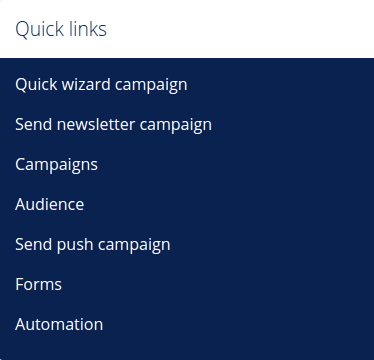
The Quick links menu on the right side of your Marketing dashboard gives you quick access to settings for managing your customer databases, forms automation and campaigns.
Below you can find short descriptions of all the metrics and statistical data on your Marketing dashboard:
# Contacts growth
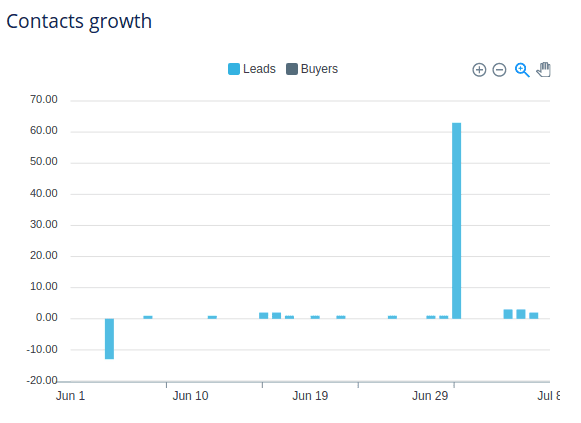
The Contacts growth graph shows the growth of your database of contacts, which are split into Leads (potential buyers) and Buyers (site visitors who placed an order). By clicking Leads, the information about the buyers will remain in the graph and vice versa. Your Contact growth includes both contacts who registered through your selected site as well as contacts that have been imported into your database.
# Campaign performance
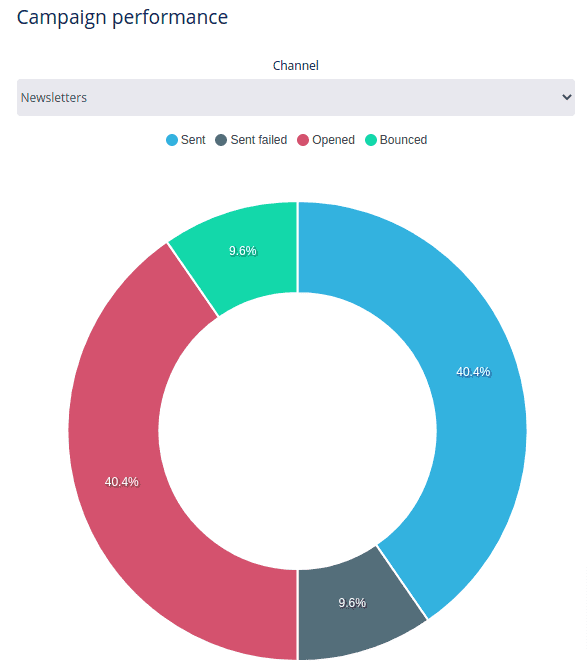
The Campaign performance donut graph shows the campaign channels and the statistics of opened, bounced and failed campaigns. Select a channel and scroll over the graph to see the number of sent, opened or failed messages.
# Contacts
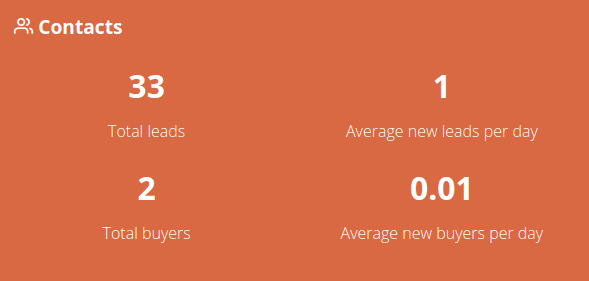
The Contacts summary shows the total number of leads and buyers as well as the average number of new leads/buyers per day in the selected period of time.
# Top 5 forms
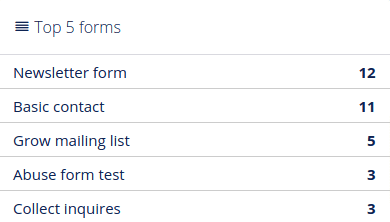
The Top 5 forms section gives you an overview of your most popular forms and shows how many times they have been filled out in the selected period.
# Top 5 newsletters
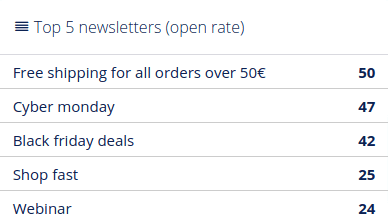
The Top 5 newsletters section shows the newsletters sent in the selected period with the highest open rate.
# Customer growth by mailing list
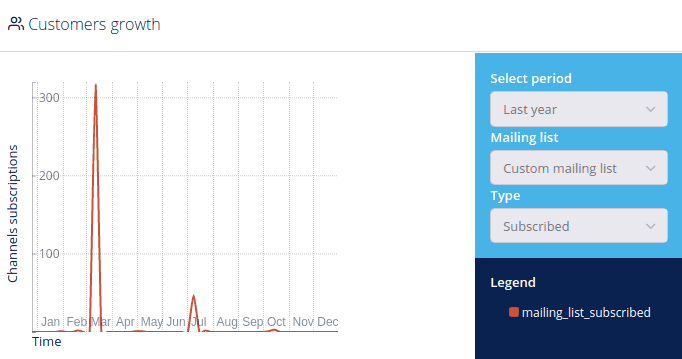
The Customer growth graph provides an overview of your customer growth over time in reference to the selected mailing lists and subscriptions.
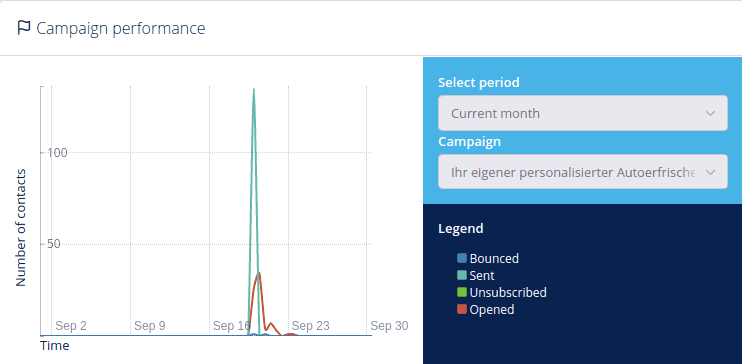
# Campaign performance by campaign
The Campaign performance graph shows how successful your marketing campaigns are in terms of sent, open, bounced and failed messages.
# Links
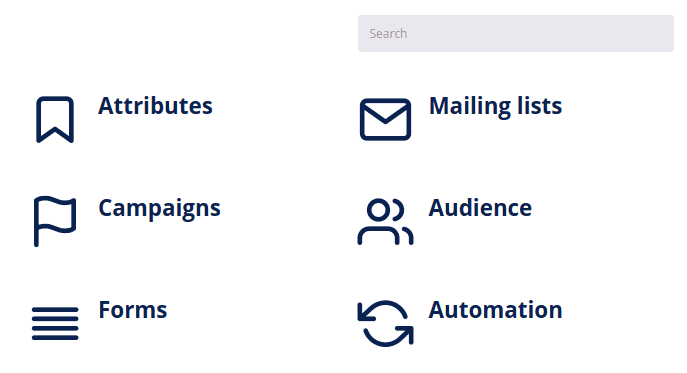
If you know what you are looking for, but don’t quite know where to find it, you can use the search section at the bottom of the Marketing dashboard page to quickly find and navigate to the required settings or index page within your Marketing panel. The incremental or real-time search field will instantaneously return results if the searched keyword can be found within your DG1 Marketing settings.
